Director : Takuma Nakata
Graphic Design : Yoshiko Akita
Motion Design : Yohsuke Chiai
Producer : Kentaro Komatsu (CEKAI)
Space Design : NOUVELLE VAGUE
Hardware Development : JNOME
Credits
Special Thanks : Kotaro Ueda
Coding Support : Yuta Inada
Photography : Miki Takahira
Music : Yunosuke Senoo
Other List






04
Sketch
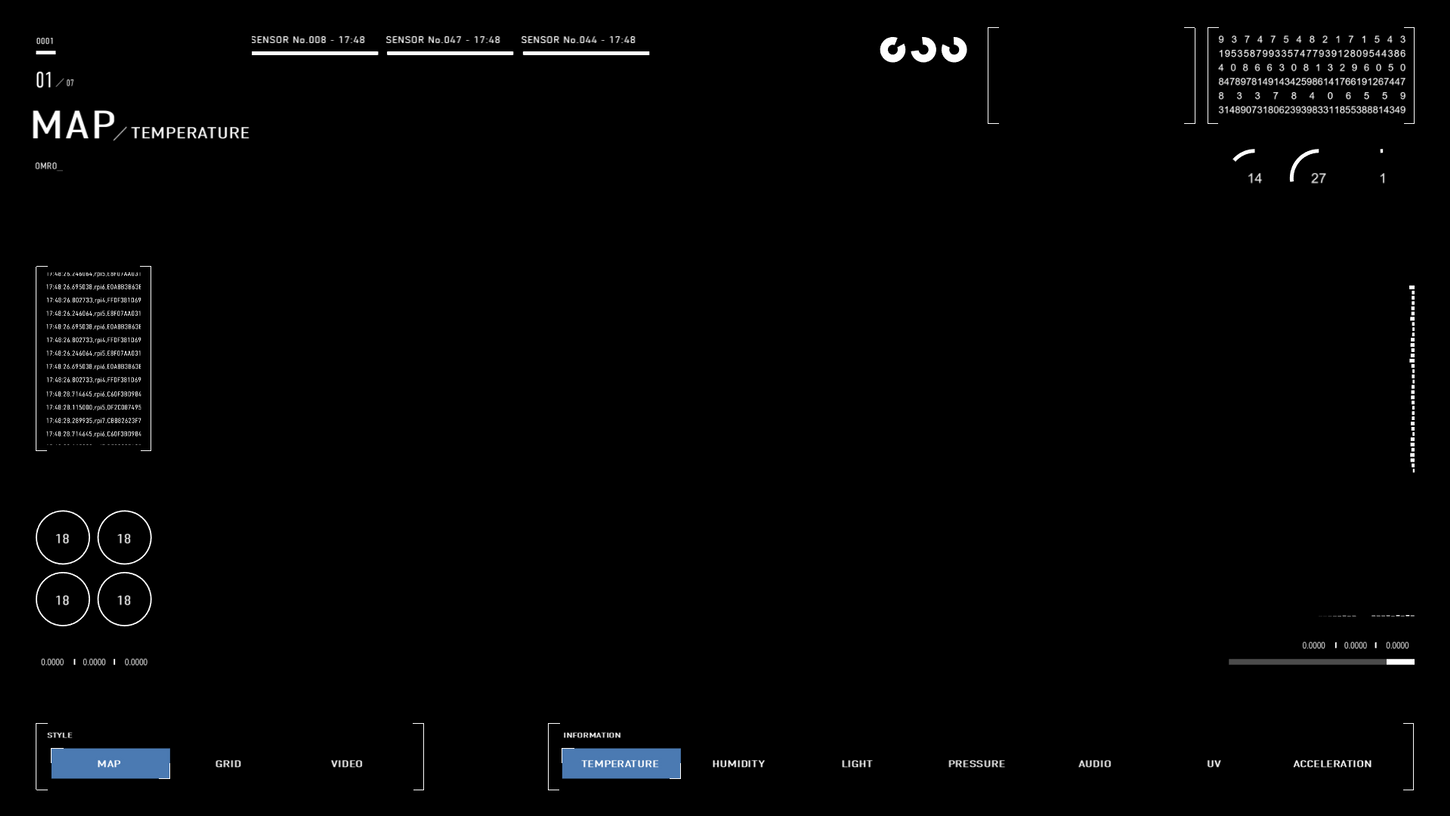
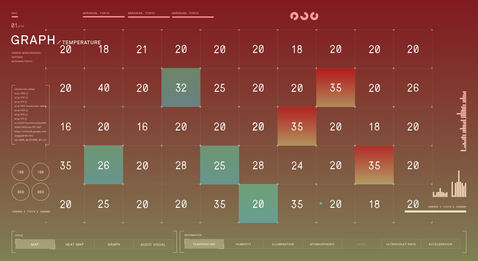
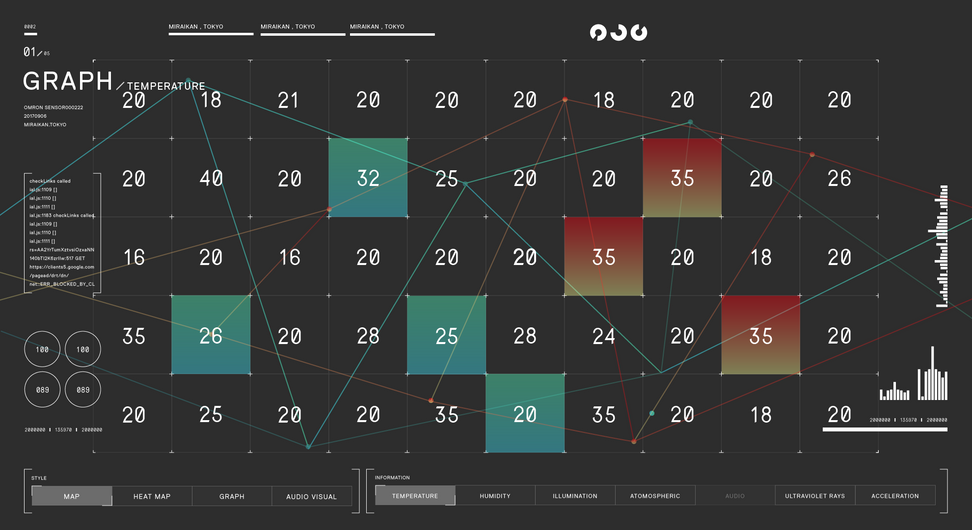
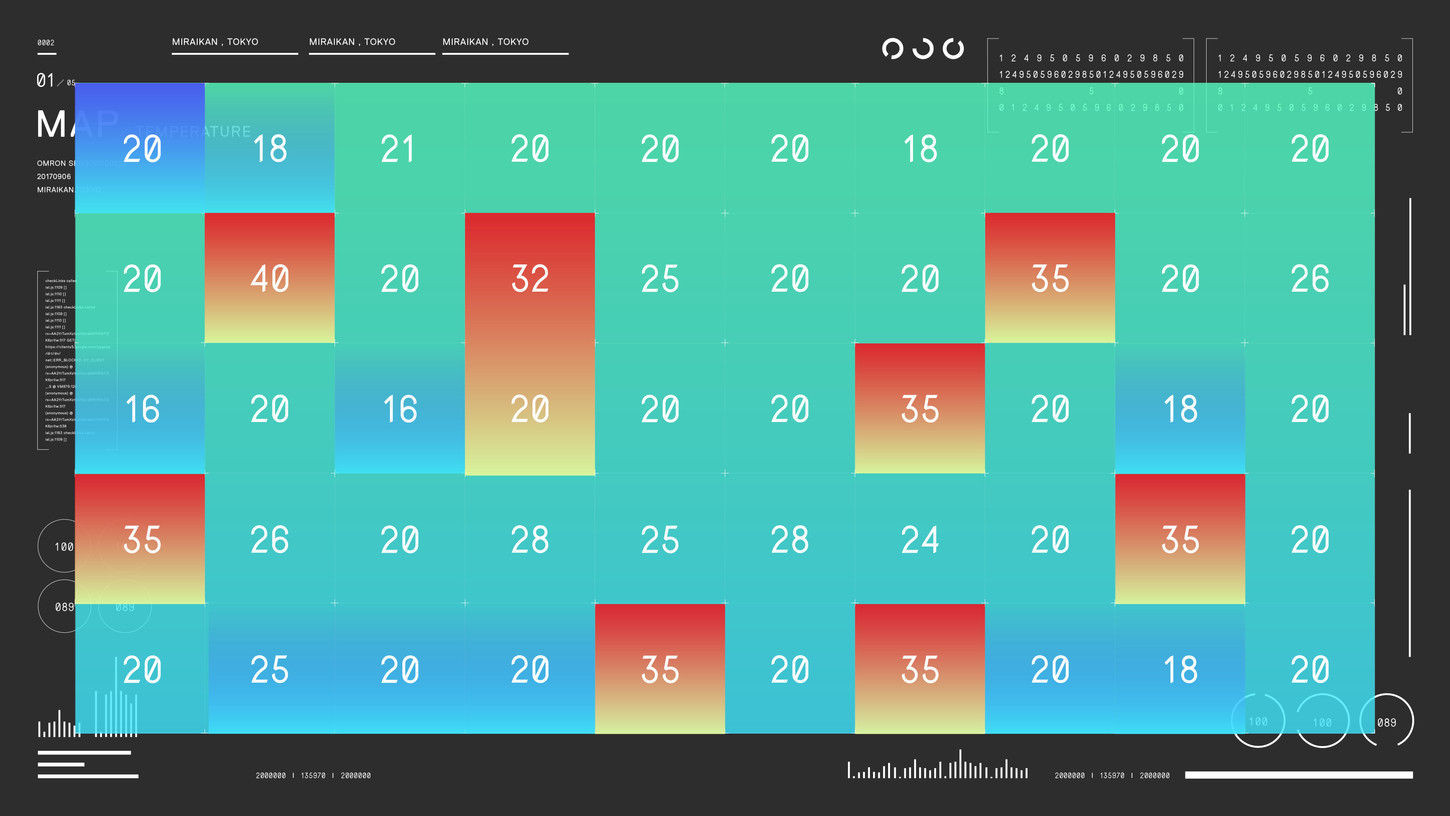
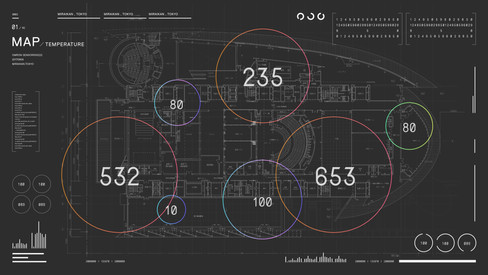
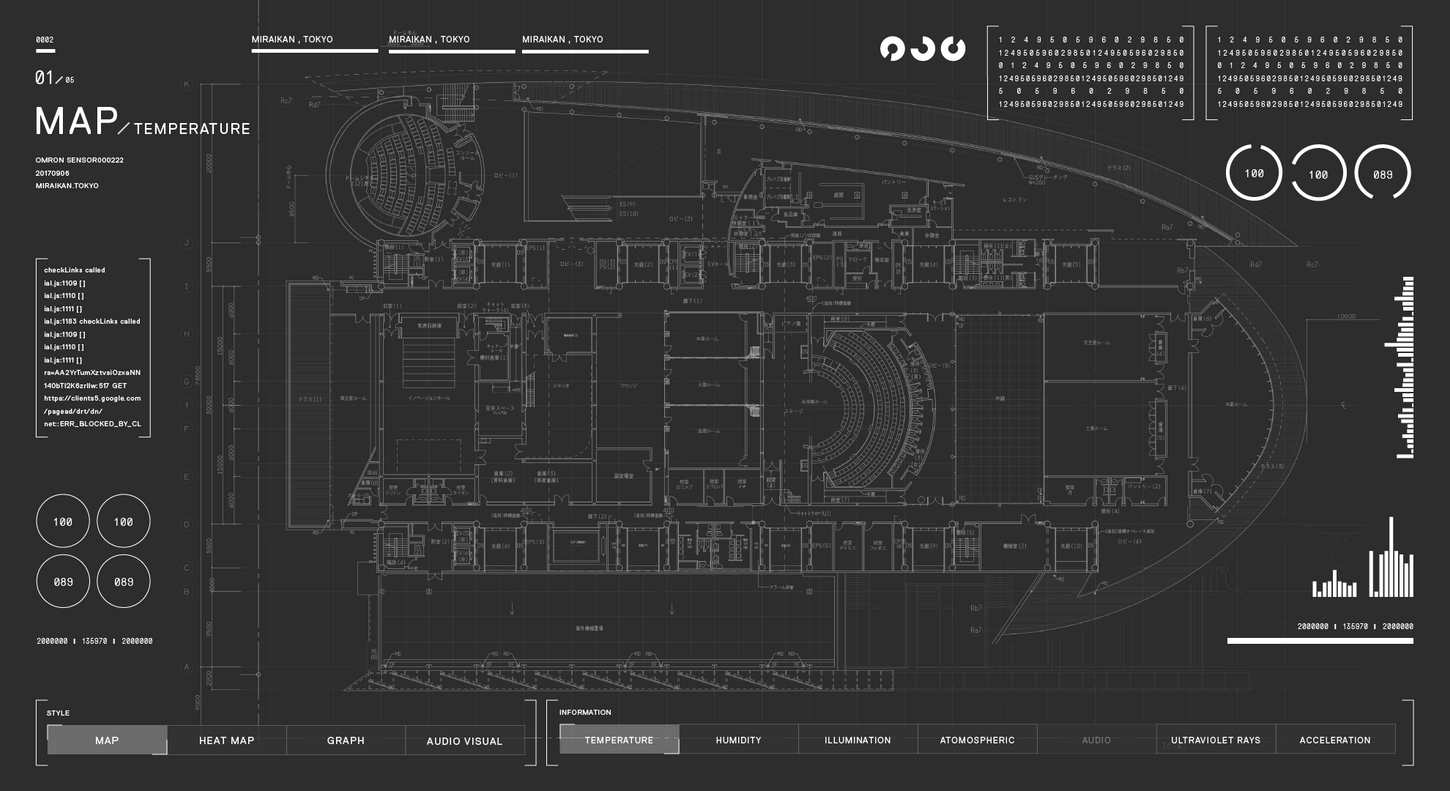
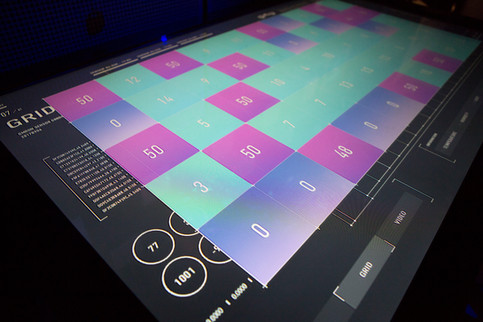
Yoshiko who took part of the UI design first made variety of sketches to specify the font, color grid, based on different transition.
After receiving her design, Yohsuke designed an animated version of it to specify the motion of each UI module.
By referring these, I re-designed the entire design inside vvvv by specifing the distance of each vertices based on pixel space, animated them.






01
Video


03
Software
The development part was split to 2 parts.
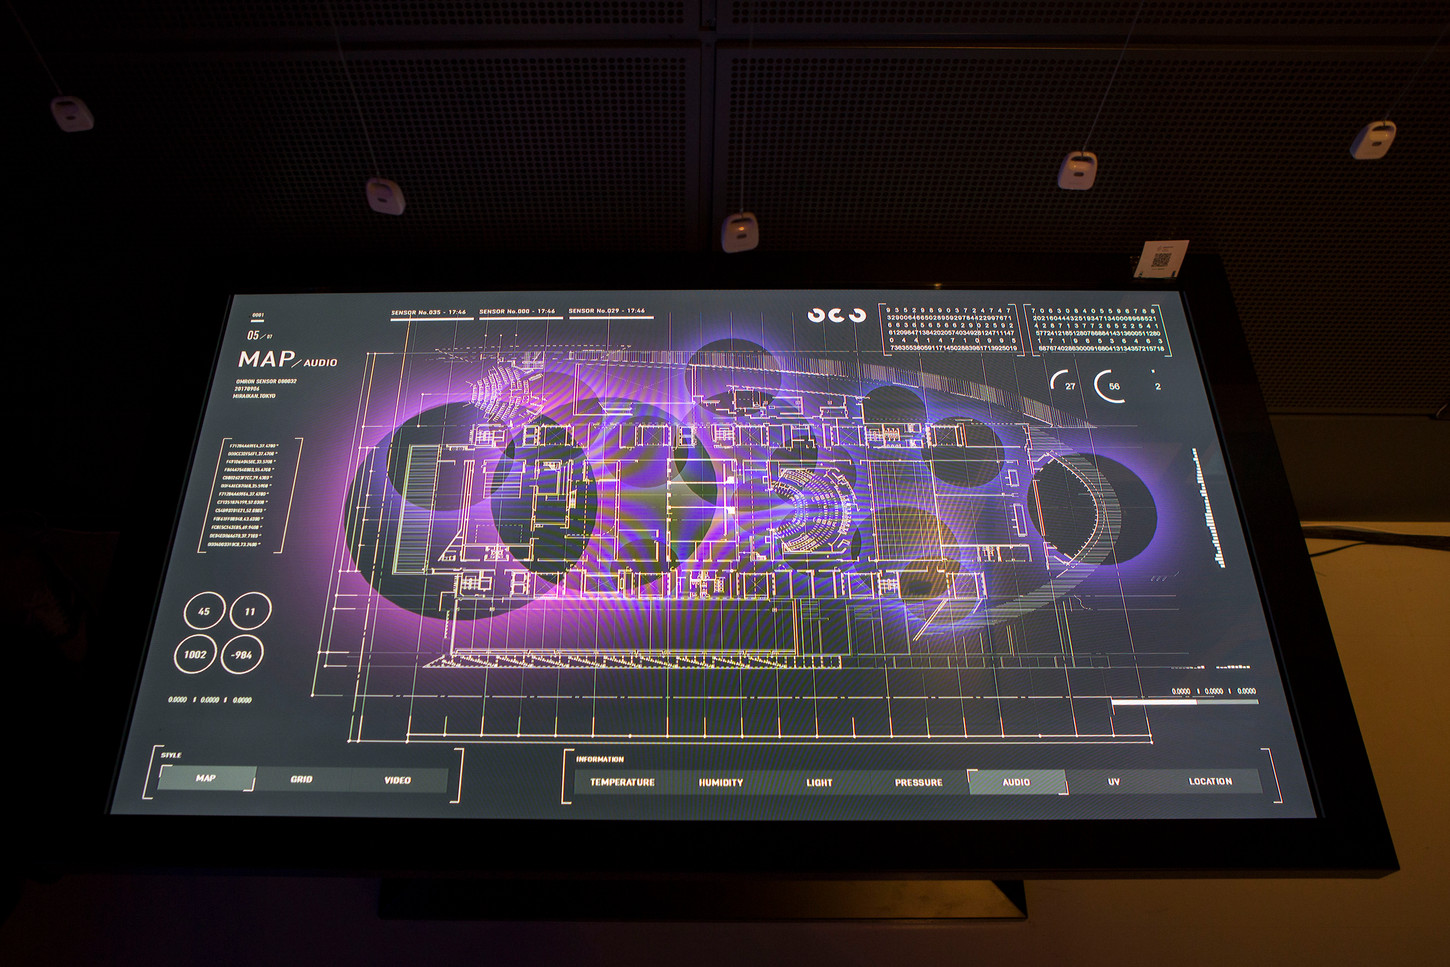
Our part was to design the whole exhibition space, interface and the functionality behind the surface to make sure all the in coming data were visualized perfectly. The other part taken part by JNOME was to develop the hardware and software to collect all data from 50 different devices, store it to cloud, and send send it back to the local machine which operates the UI, which also required developing 16 raspberry pi modules to analyze the location of each device.
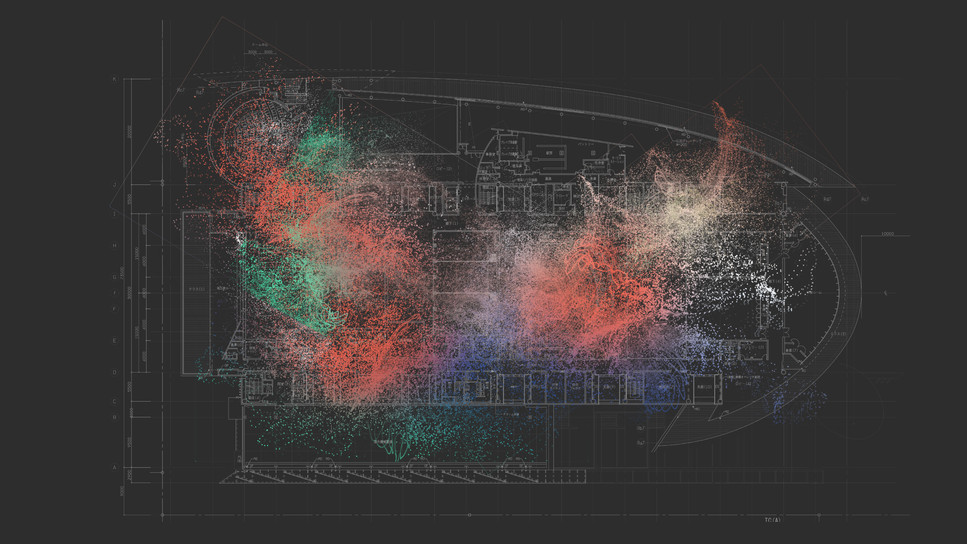
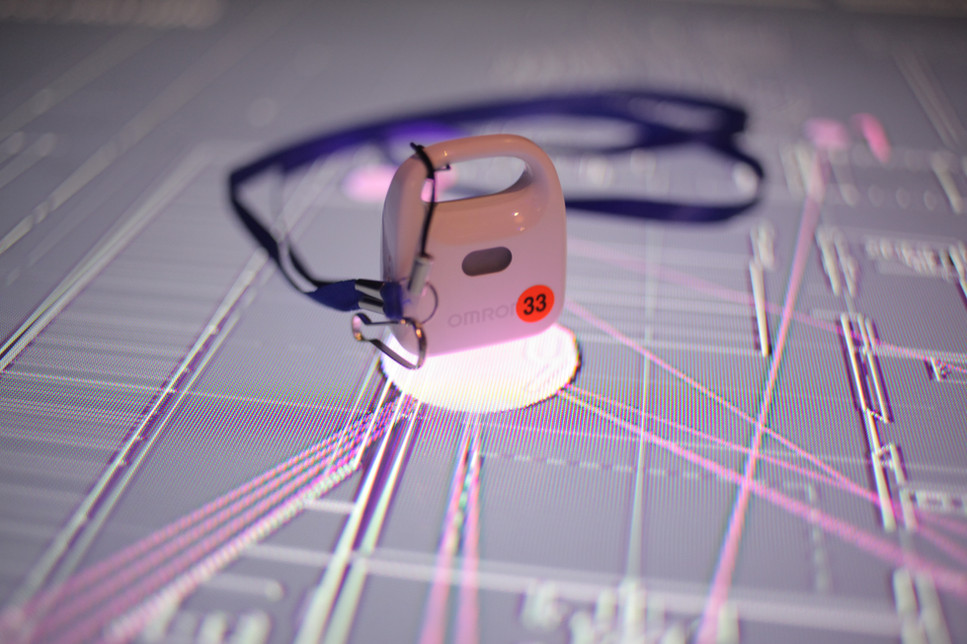
Each sensor kept sending data every 1 second. Sensors were connected to the gateway via Bluetooth, to upload data over network. Software designed using vvvv had access to the network, to receive fresh data uploaded on the server. We located 16 gateways and 20/50 sensors all over the map to constantly collect data of the certain room. Other 30/50 sensors were worn by volunteers to visualize real-time data. Gateway had a function to identify the nearest gateway of each sensor. We used this function to visualize how people move from one possition to the other.



02
Diagram
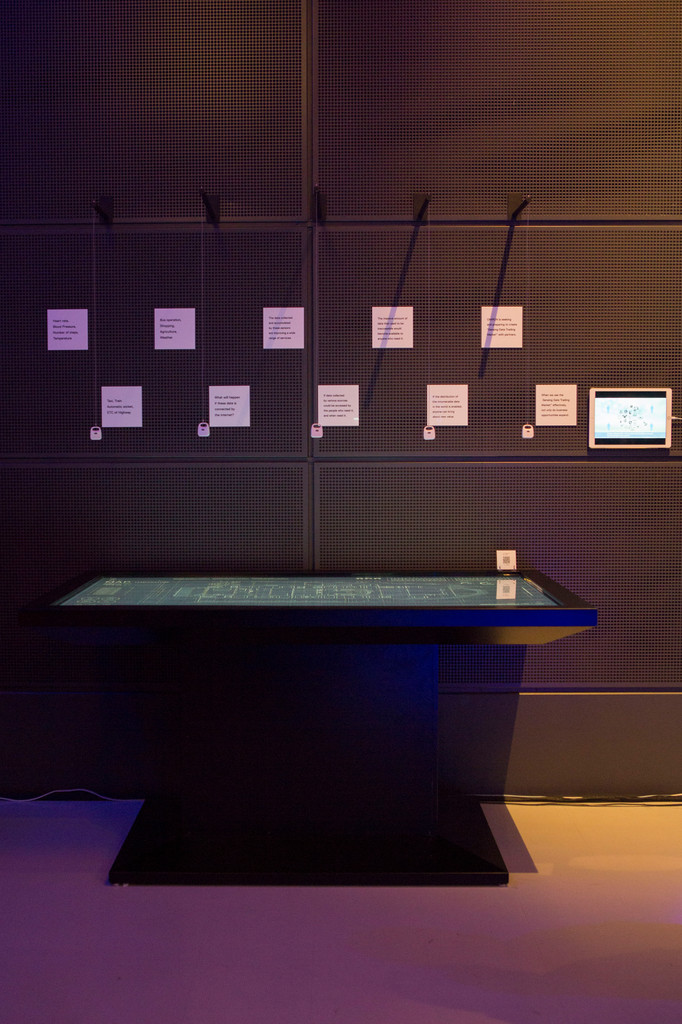
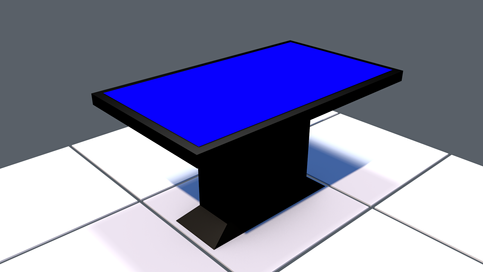
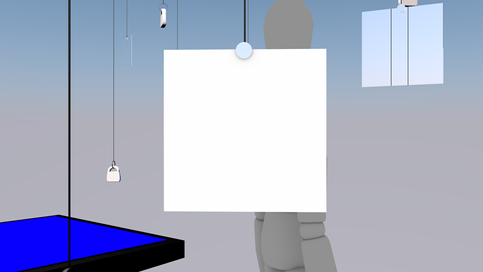
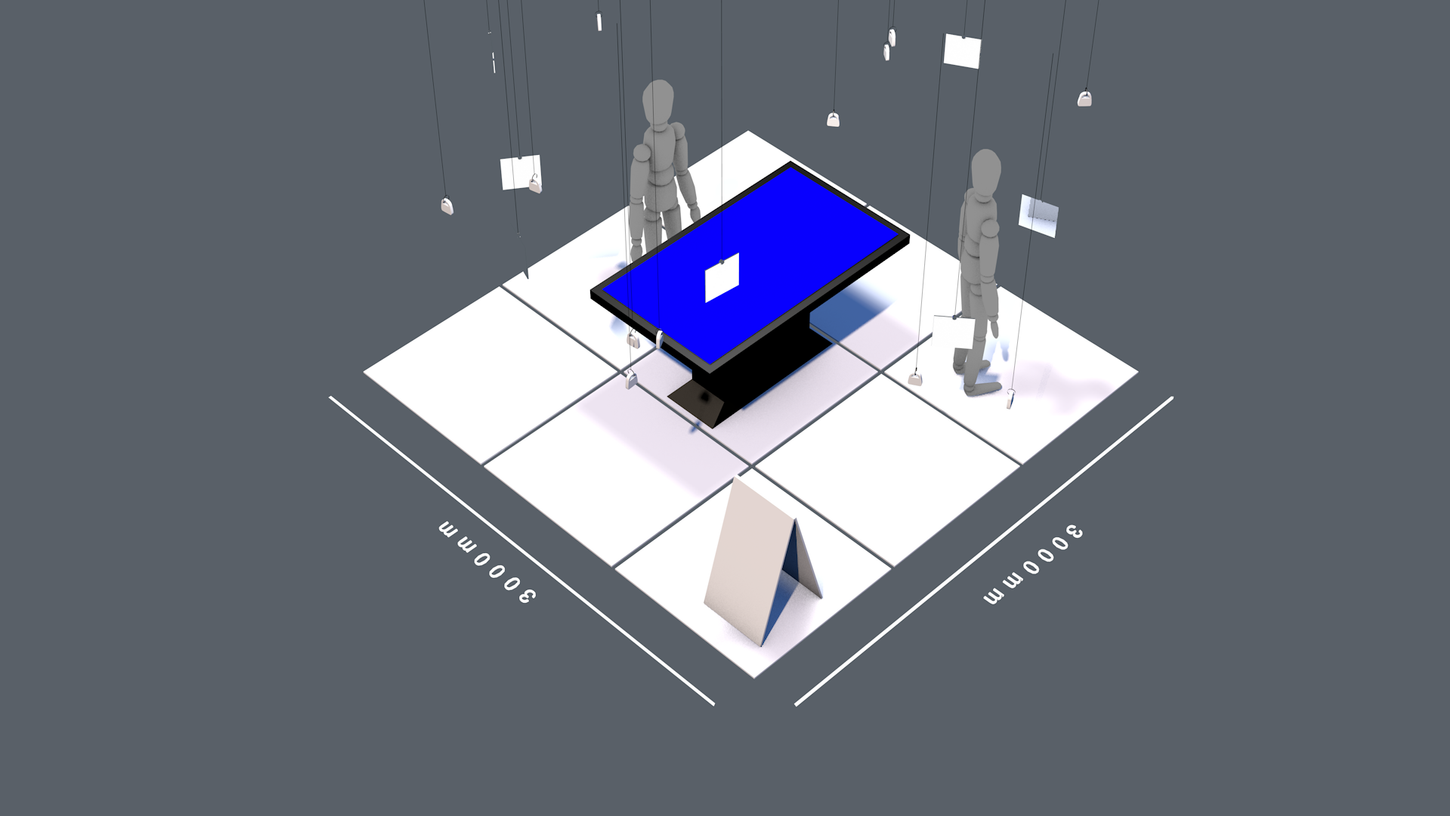
Since our goal was clear from the start, designing the installation was quit easy. After getting the diagram of the space, I made a 3D sketch of the setup to clearly identify what was going to happen and presented this to the client.
Omron Light Table
SingularityU Japan Summit
On September 6th ~ 8th 2017, we designed an Interactive IoT visualization Table, using the environment sensor released by OMRON (Japanese hardware Company).
Our mission was to promote and engage the audience with an exciting usage of this sensor which allows you to collect 7 different data such as temperature, humidity, uv, pressure, light, audio and acceleration. There for, we decided to design a futuristic but functionable UI for the audience to interactive with the sensor and the data.
Touch Table Interface
IoT Visualization
Custom Software


.jpg)


.jpg)


